I report it here, just to report my work.
This article starts from this: http://arduino.cc/en/Tutorial/TemperatureWebPanel that explain how to use the Bridge to capture data from a temperature Sensor and make the data accessible from a web page inside an sdcard on the Yun.
Plot a chart
My scripts, it helps to plot the last 5 temperatures.
You have to change a little bit the script on the page and replace some files.
1 - I've added this at the beginning of the arduino script:
float lastTemp[5];
to save the last 5 temperatures
2 - Replaced this part
client.print("Current time on the Yun: ");
client.println(timeString);
client.print("
Current temperature: ");
client.print(temperature);
client.print(" degrees C");
client.print("
This sketch has been running since ");
client.print(startString);
client.print("
Hits so far: ");
client.print(hits);
with this one:
lastTemp[hits%5] = temperature;
for(int i=0;i<5;i++){
client.print(lastTemp);
client.print(";");
}
client.println(timeString+";"+startString+";"+hits+";");
So the page from arduino now it retuns all the data plus the last 5 temperature read, separated by ";"
3 - I've replaced the files in /arduino/www/TemperatureWebPanel with the ones HERE: it uses jquery and jflot
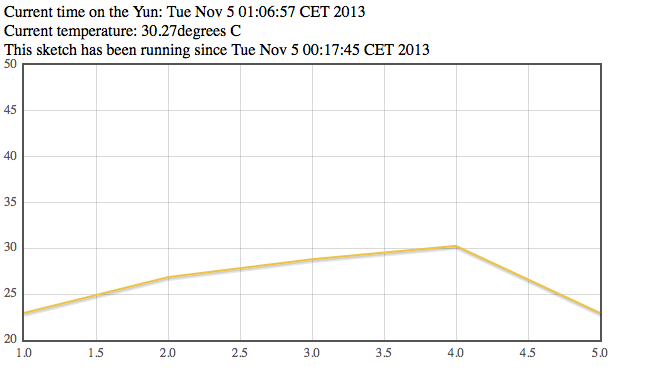
This is the final plot:
This is not the rightway
My script plot the last 5 request read from the sensor, but the right way is to leave the arduino part to ciclic fetch the temperature and save it on a file on the sdcard.
The html/js page need to read the same file and plot the temperatures with the data from the file.
I will update it later with a new solution.